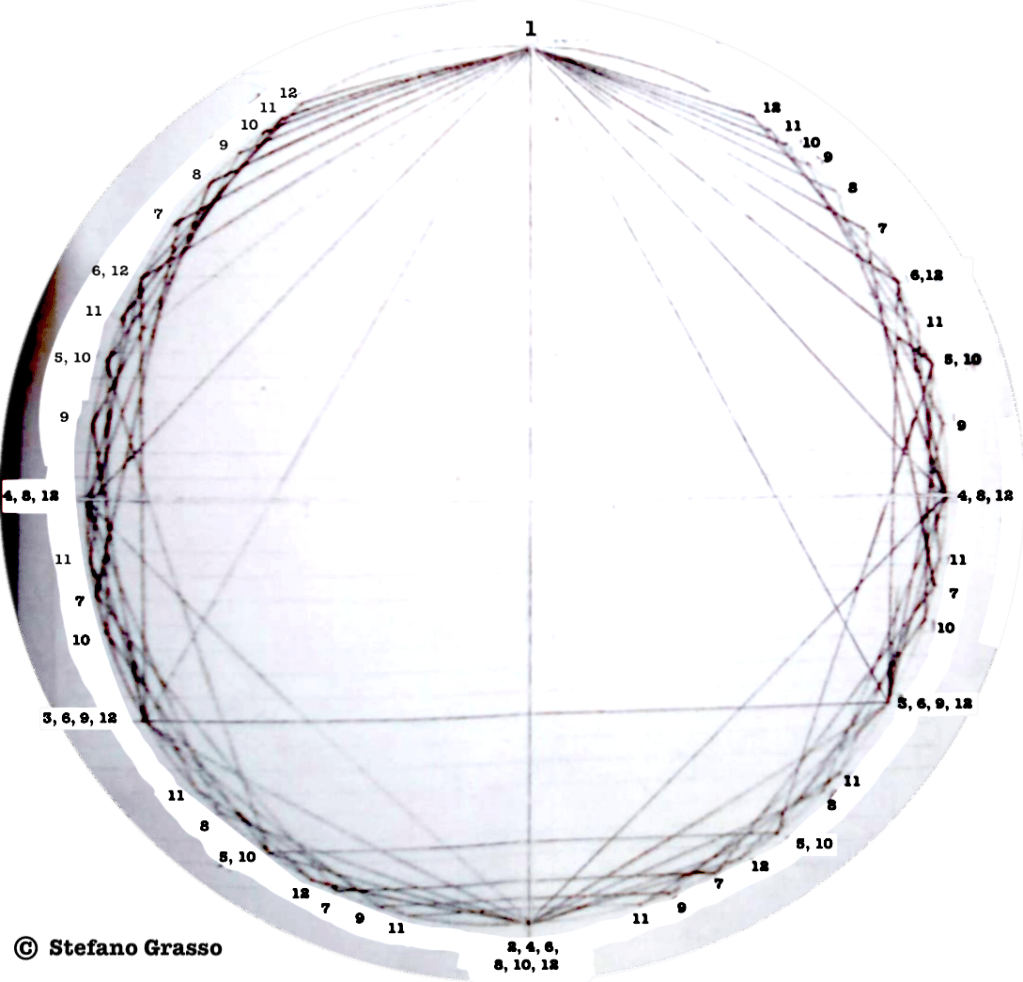
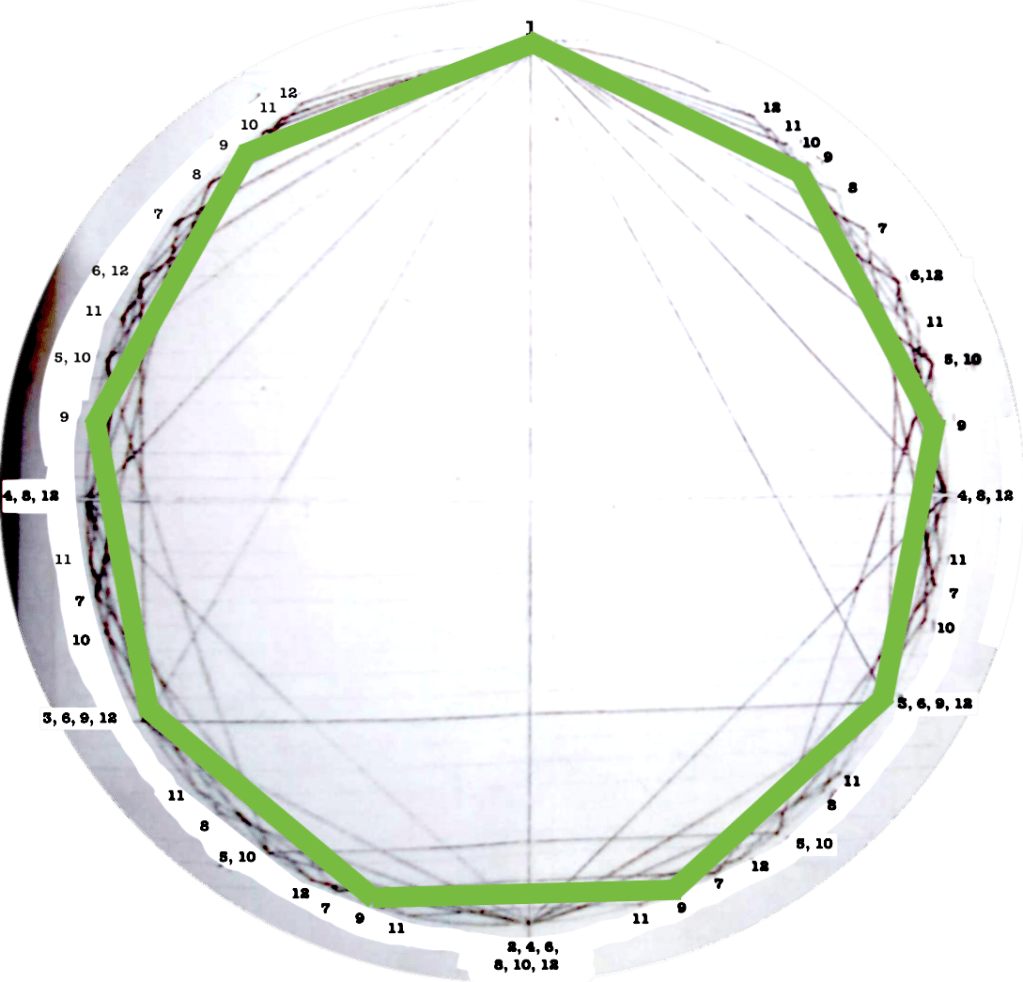
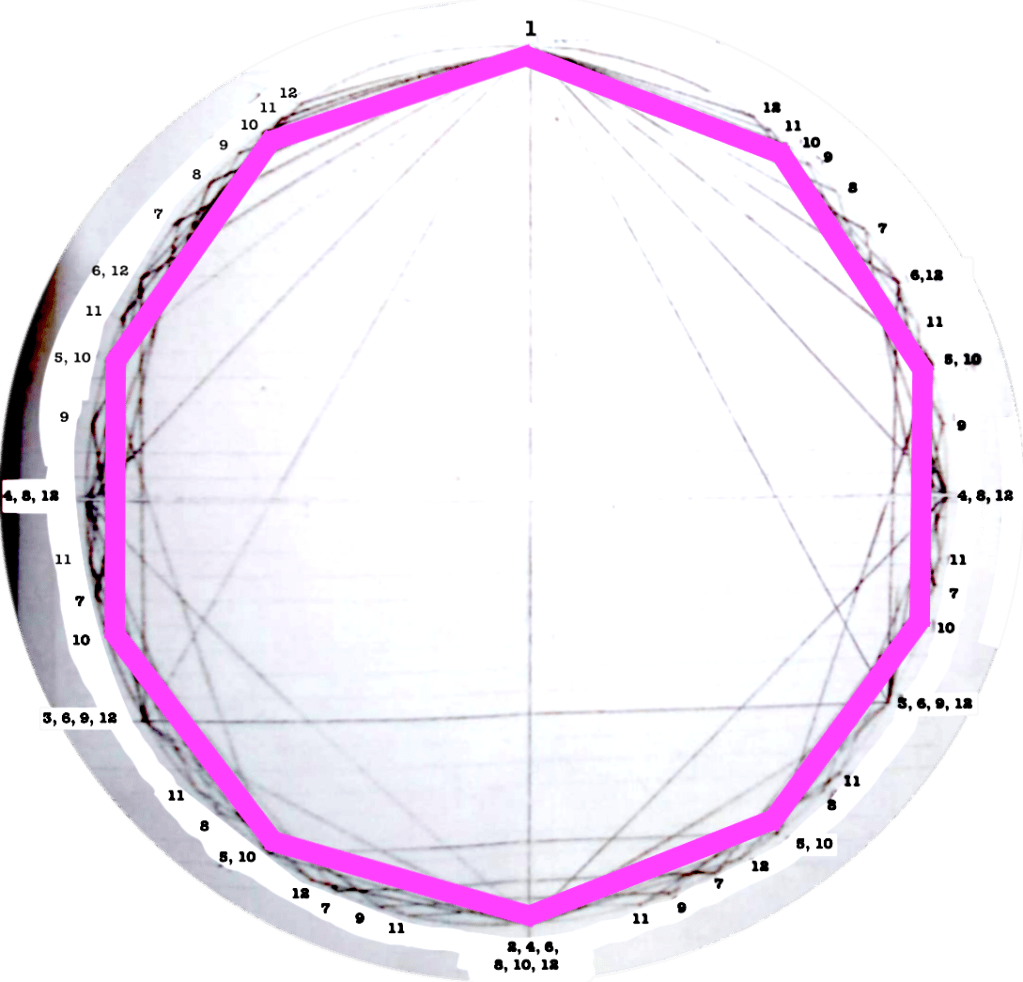
Circles is a diagram I made in autumn 2017.
I use it to observe and practice rhythms and polyrhythms, pursuing a vision that considers them as cycles, circles, space-time entities always going back to the beginning, modifying theirselves and evolving as an organic matter.
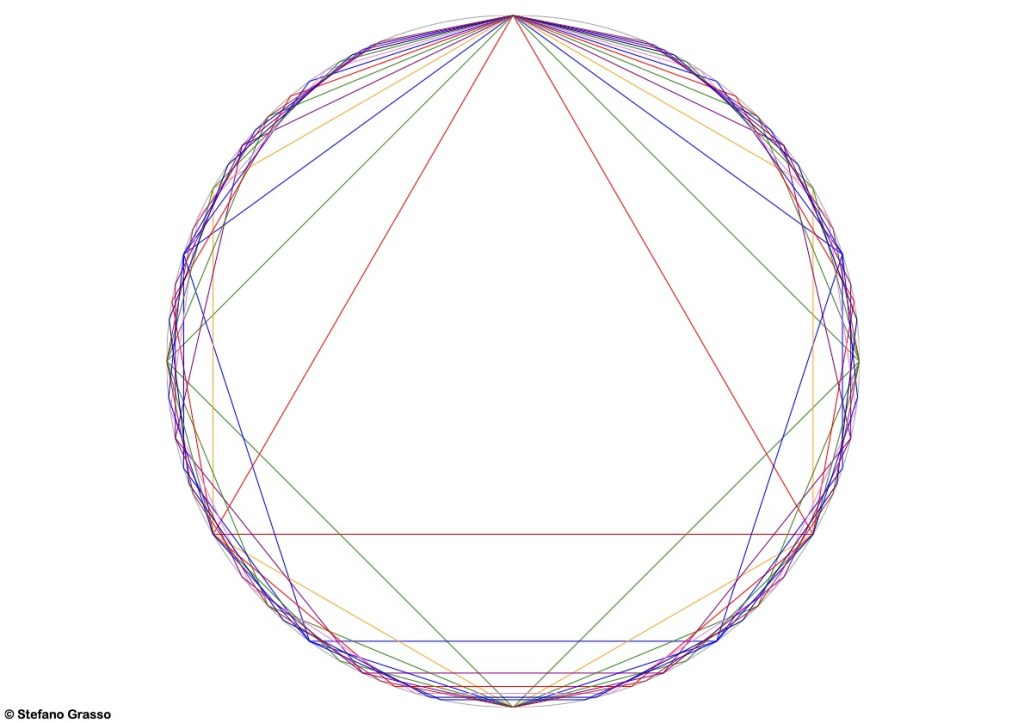
In the diagram, the diameter upward-downward identifies with upbeat-downbeat.
You can read the diagram clockwise, and each time you go back from the upper point of the circle (let’s say “noon”), there is the downbeat.
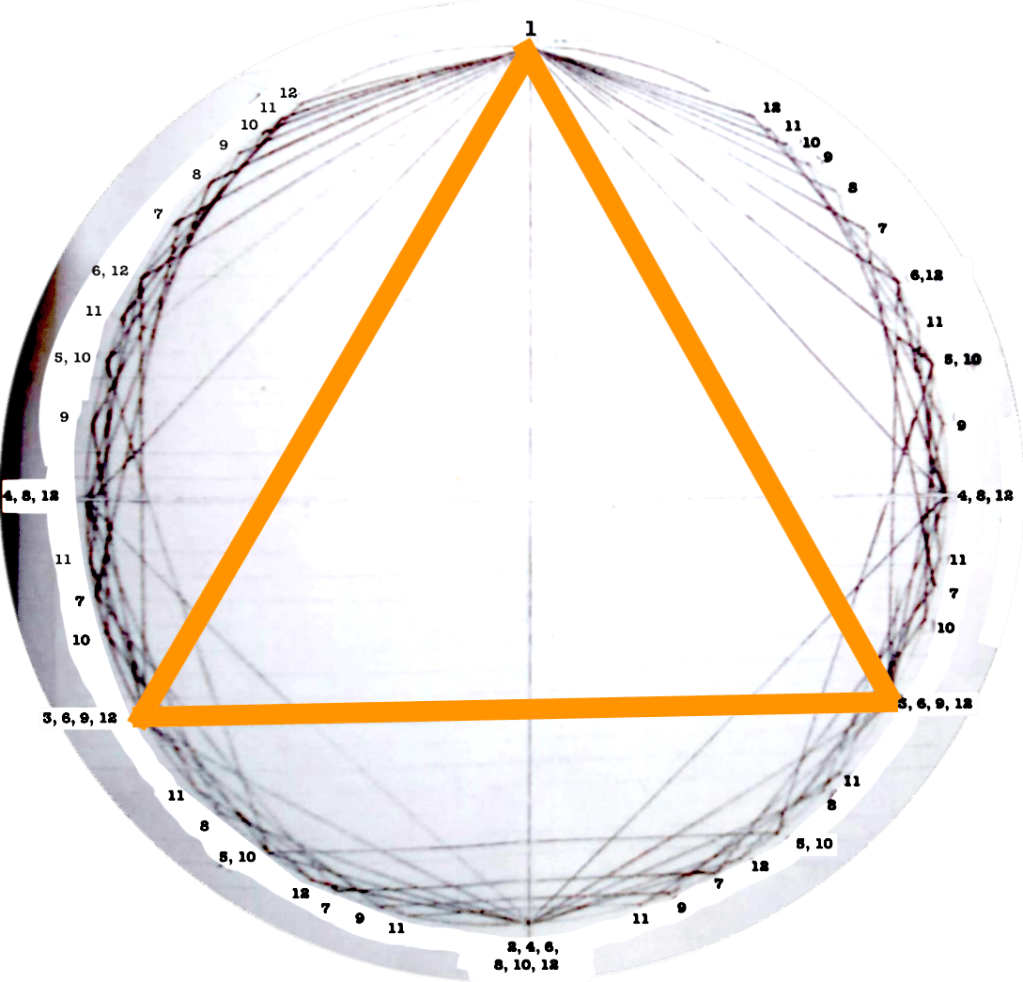
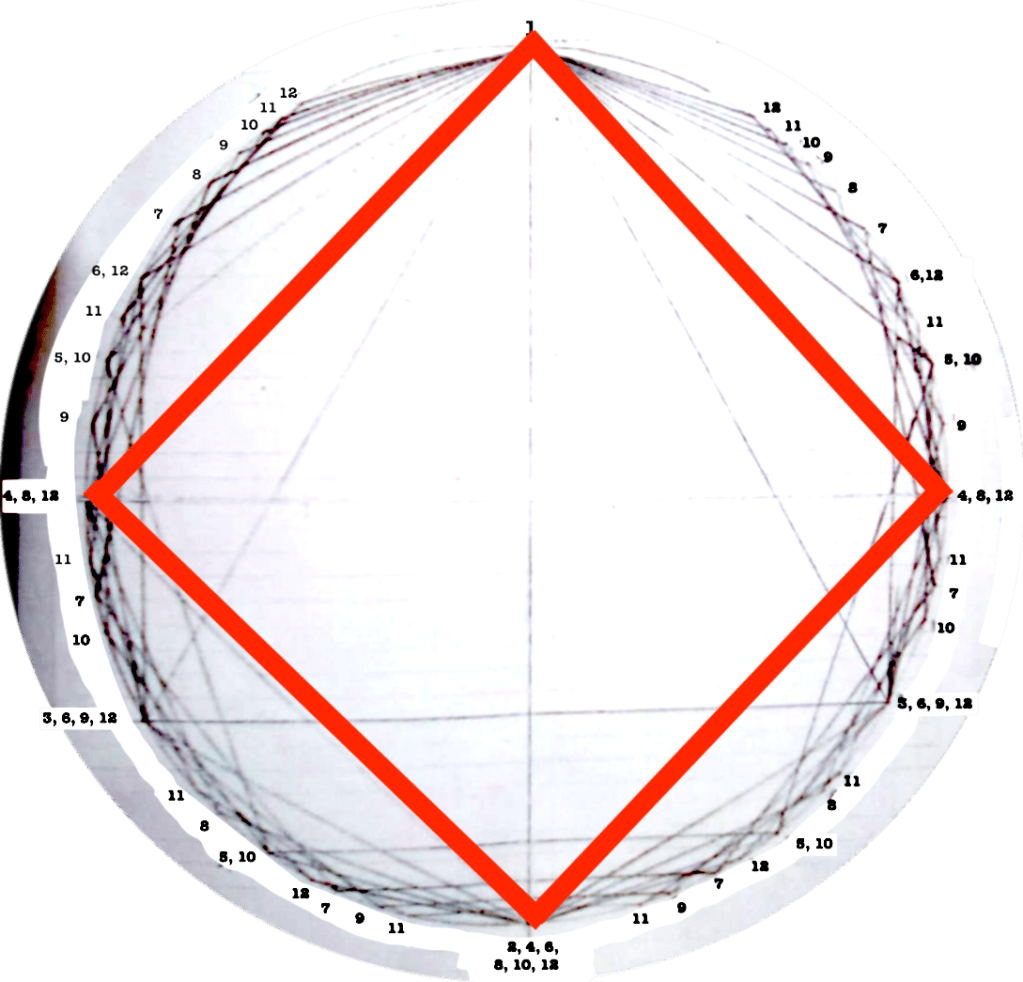
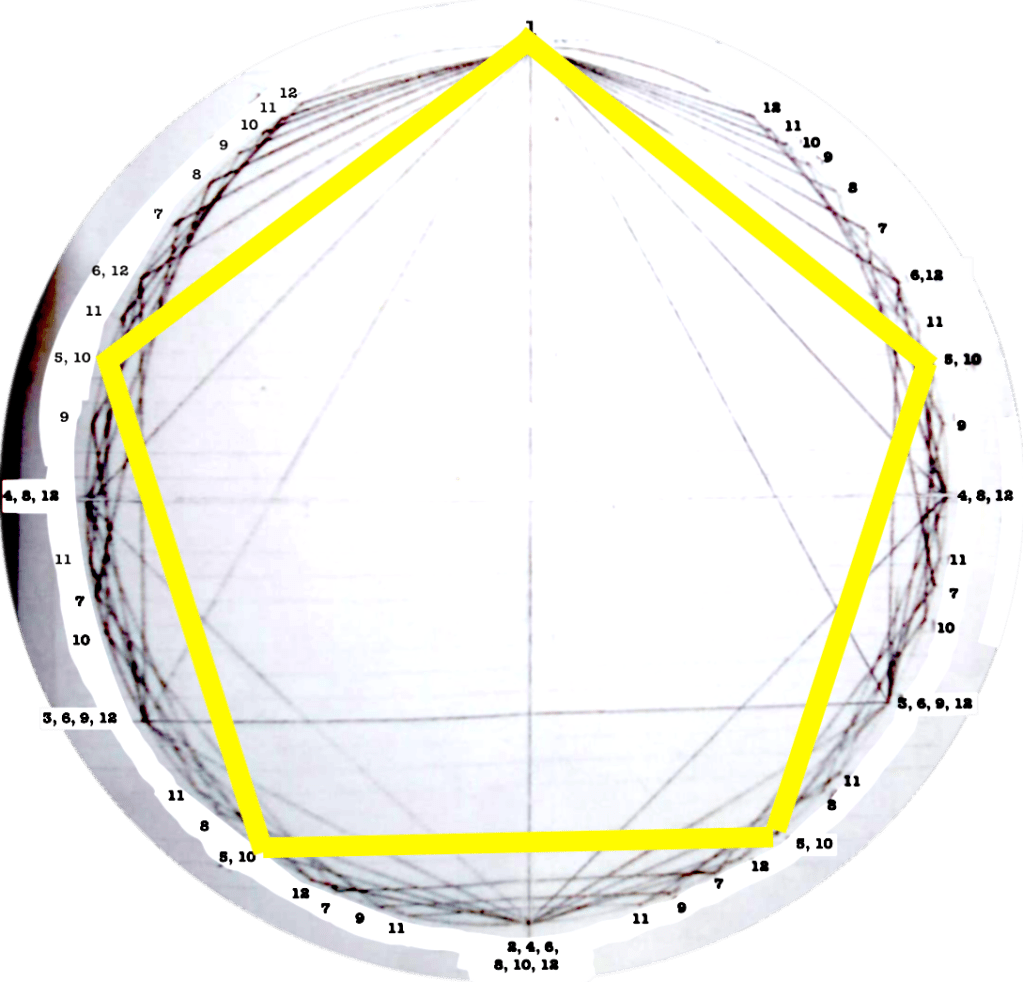
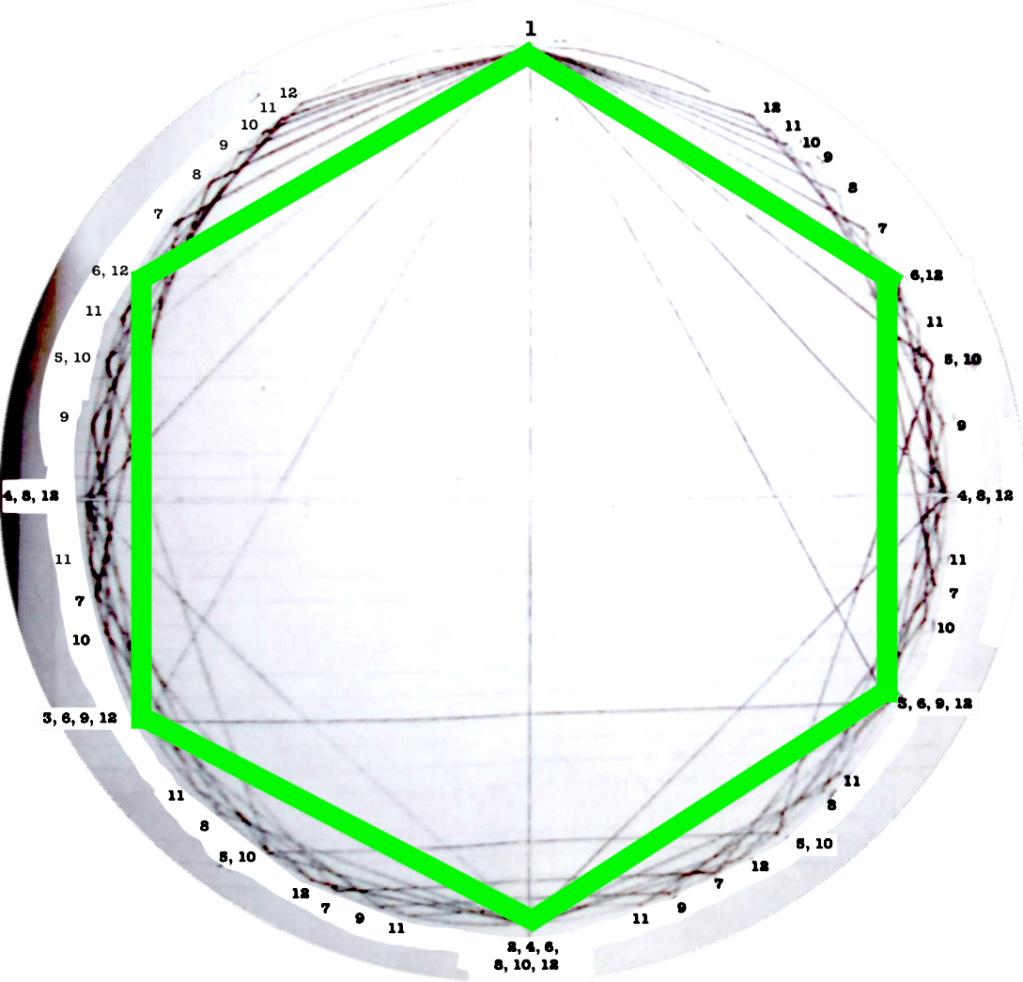
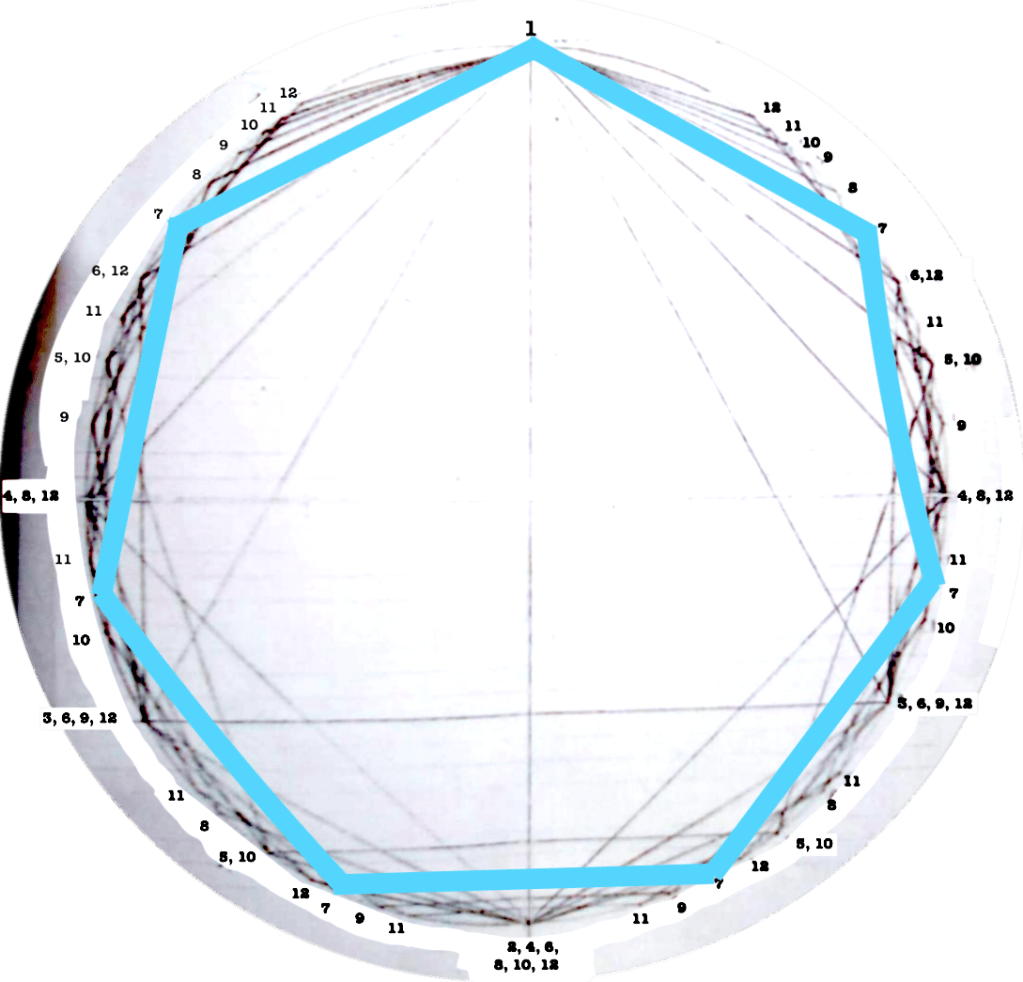
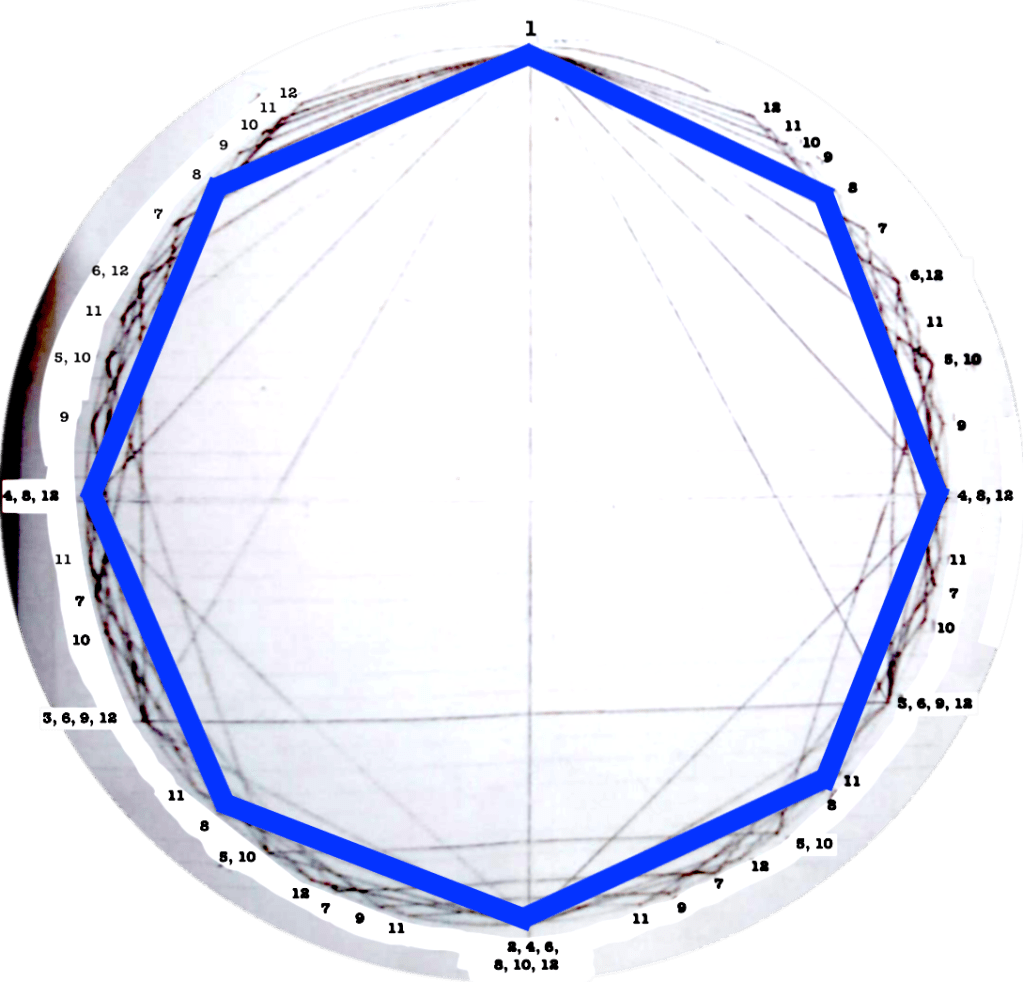
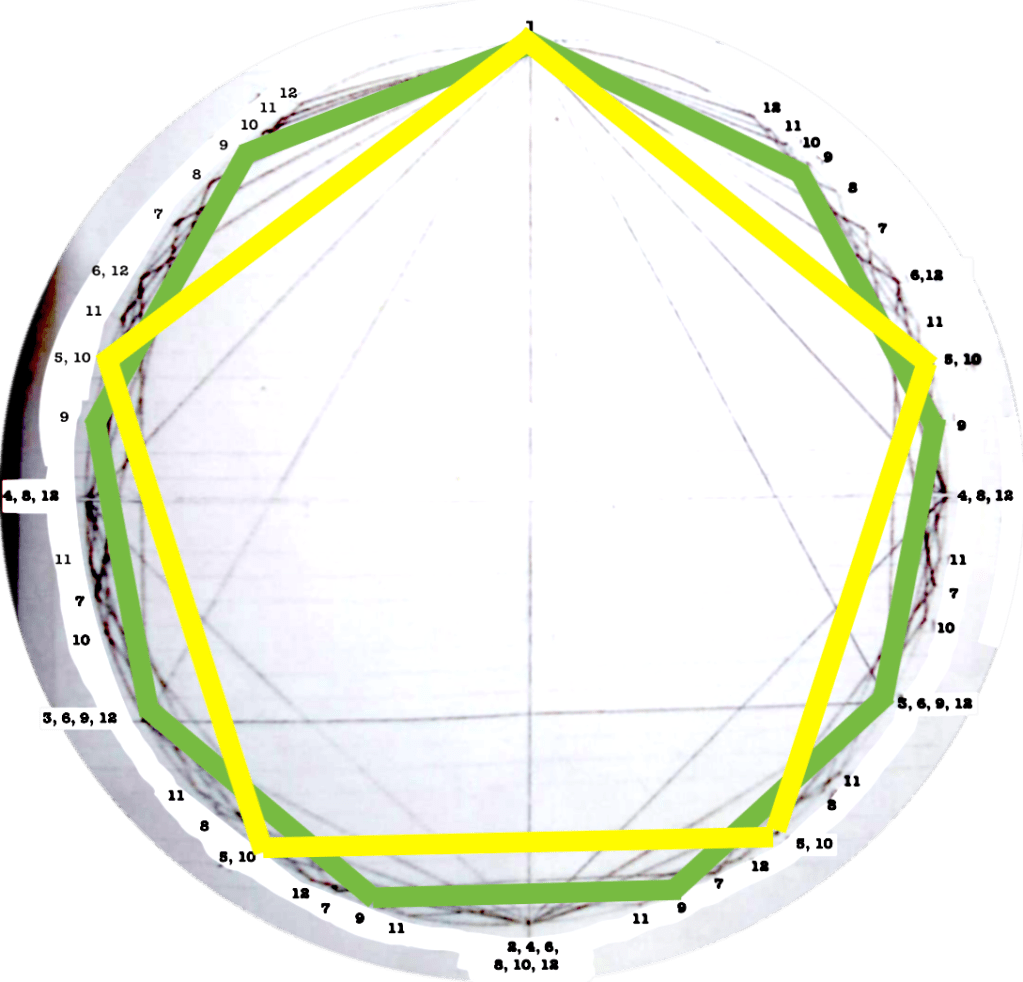
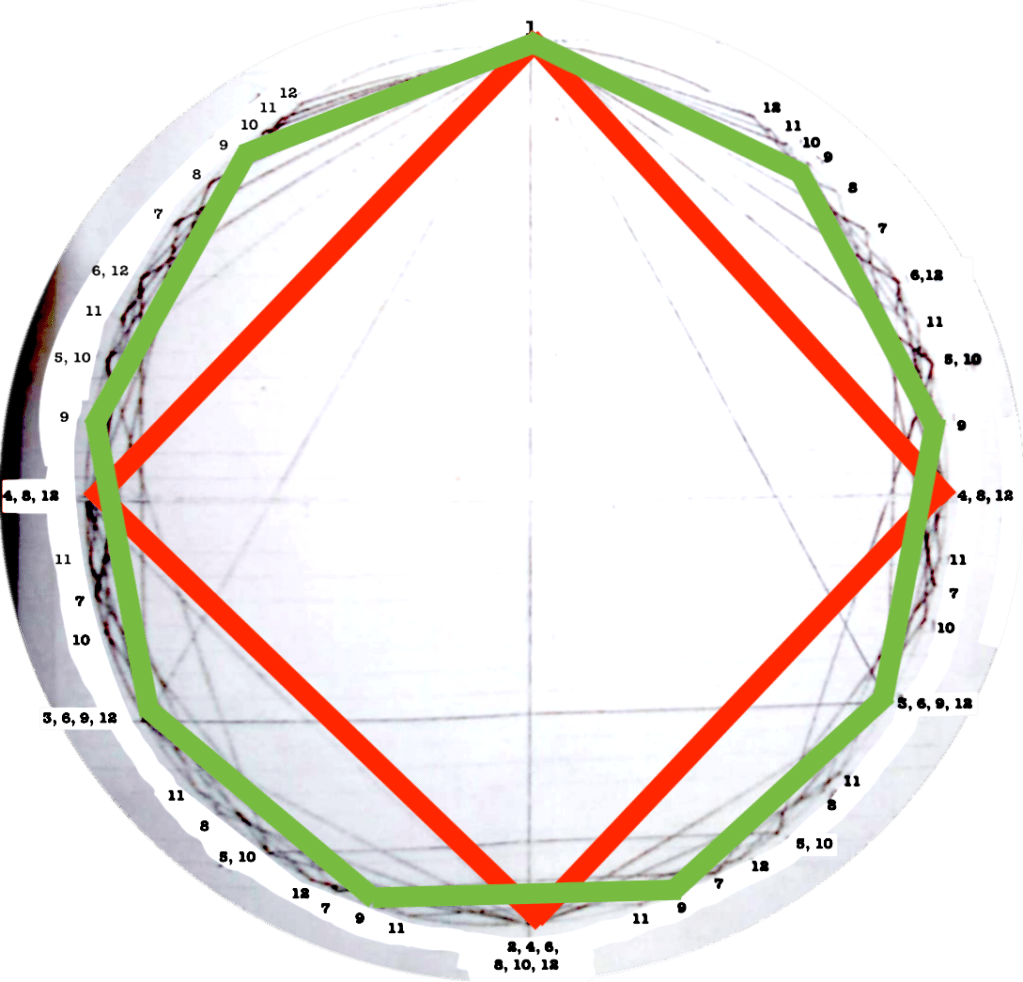
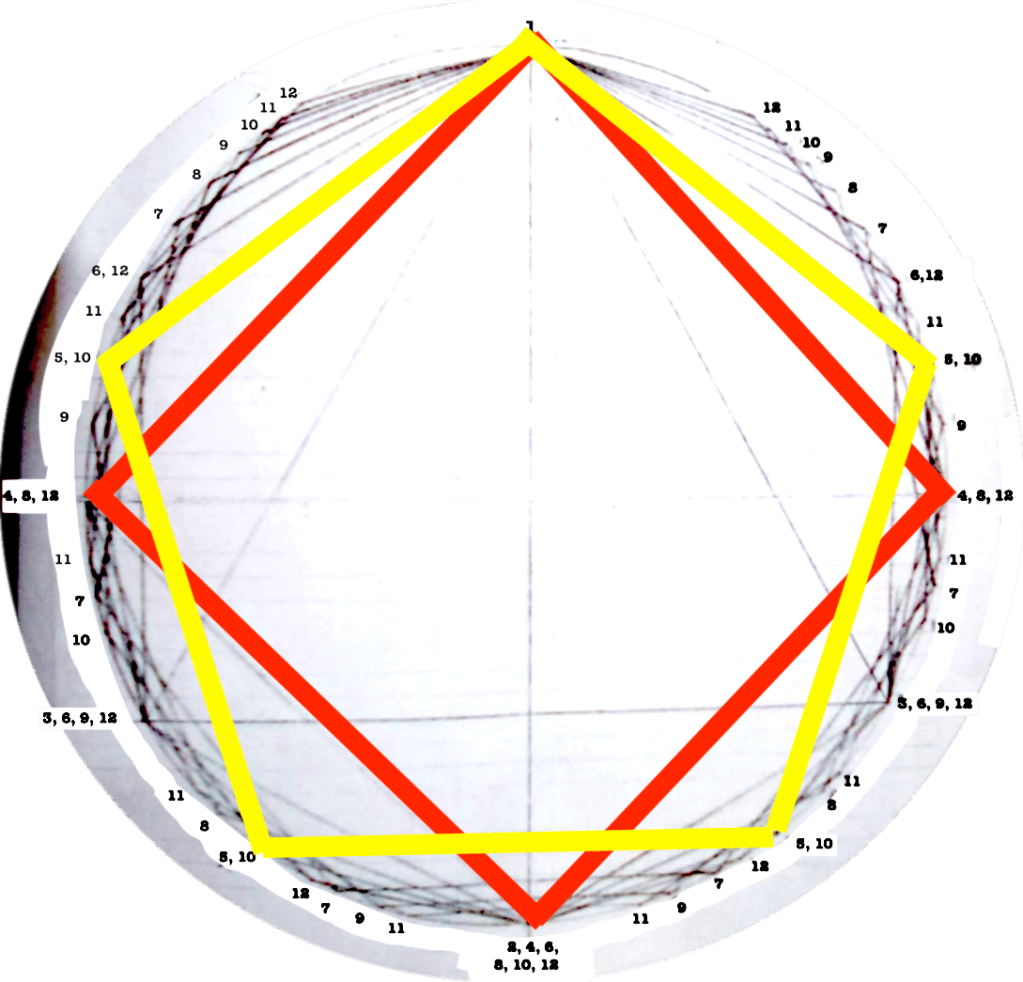
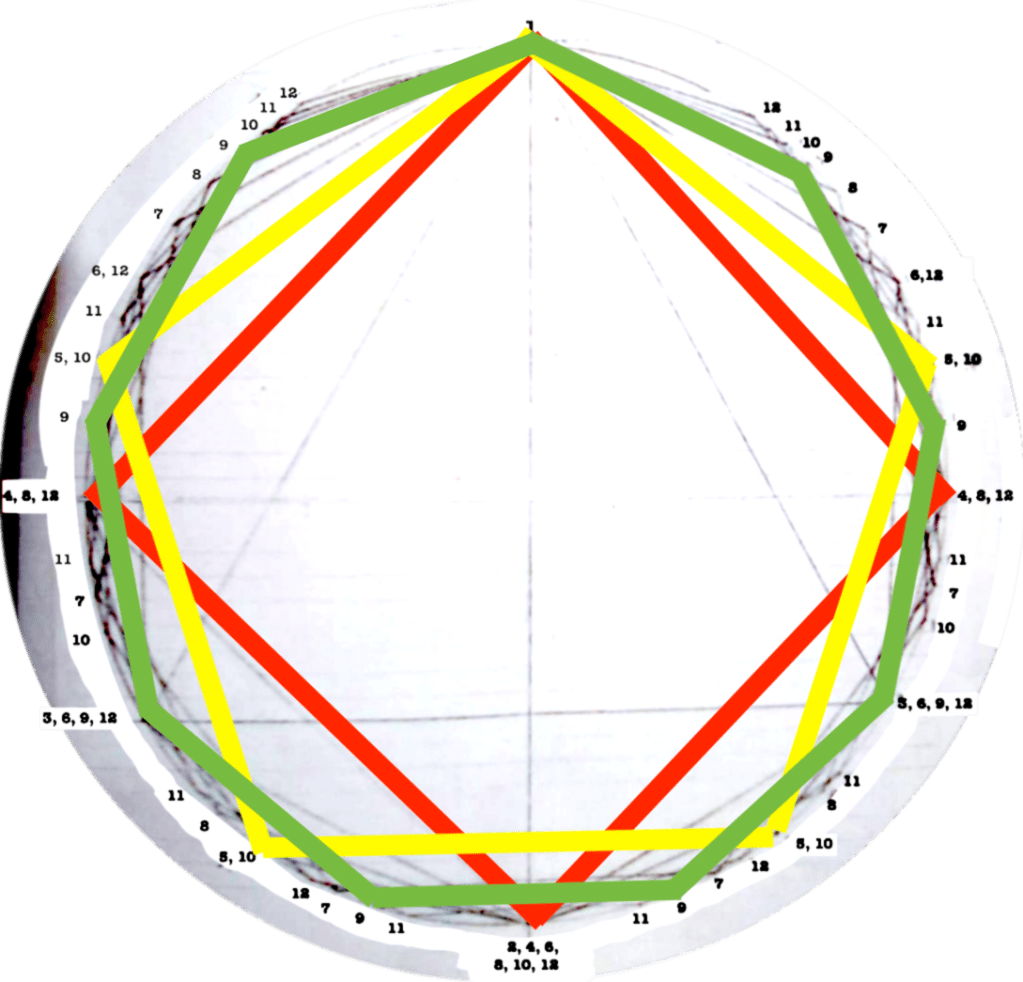
Each figure drawn in the circle represents an equilateral polygon, which gives a graphic representation of the correspective rhythmical division of the unity. This unity (the circle) can represent a bar, a beat, a subdivision, anything that has a beginning and an end.
I use this graphic representation to be able to consider the relation between each rhythm and the cycle in which it takes place, such as to observe the similitudes/difference between rhythms.
I thought about the idea of representations of time: should it be a line or a circle? could the circle be a closed line? could I open the circle and read it as a line?
Representing time through a circle it’s for me very useful as applied to music and particularly for visualizing a concrete representation of rhythms. Still, I think this circle is most likely the view of a spiral from above: it’s a bi-dimensional representation of a multidimentional entity. Thus is then also easier to imagine the possibility for different layers of the spiral to have different diameters (which is, musically speaking, the possible use of different time meters one after the other, leading to the creation of discrete time-spaces of different sizes).
A couple of observations:
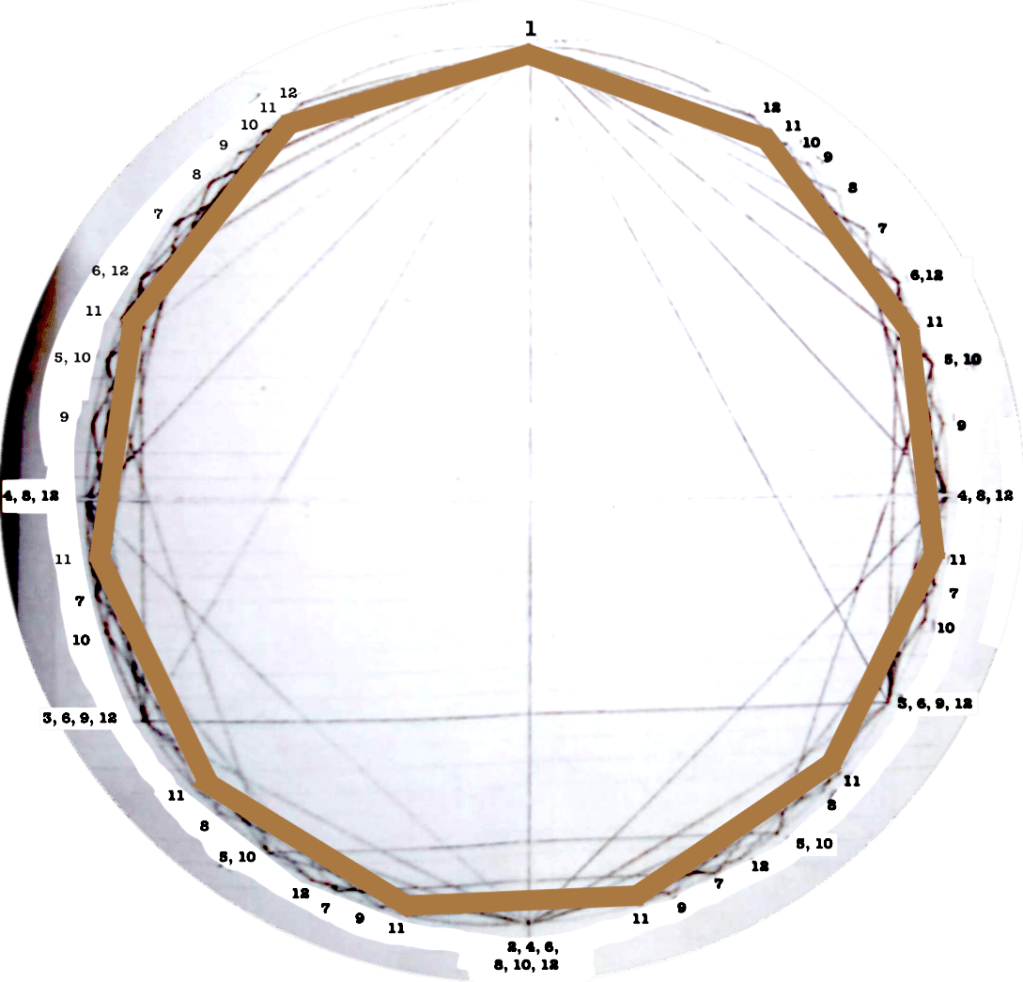
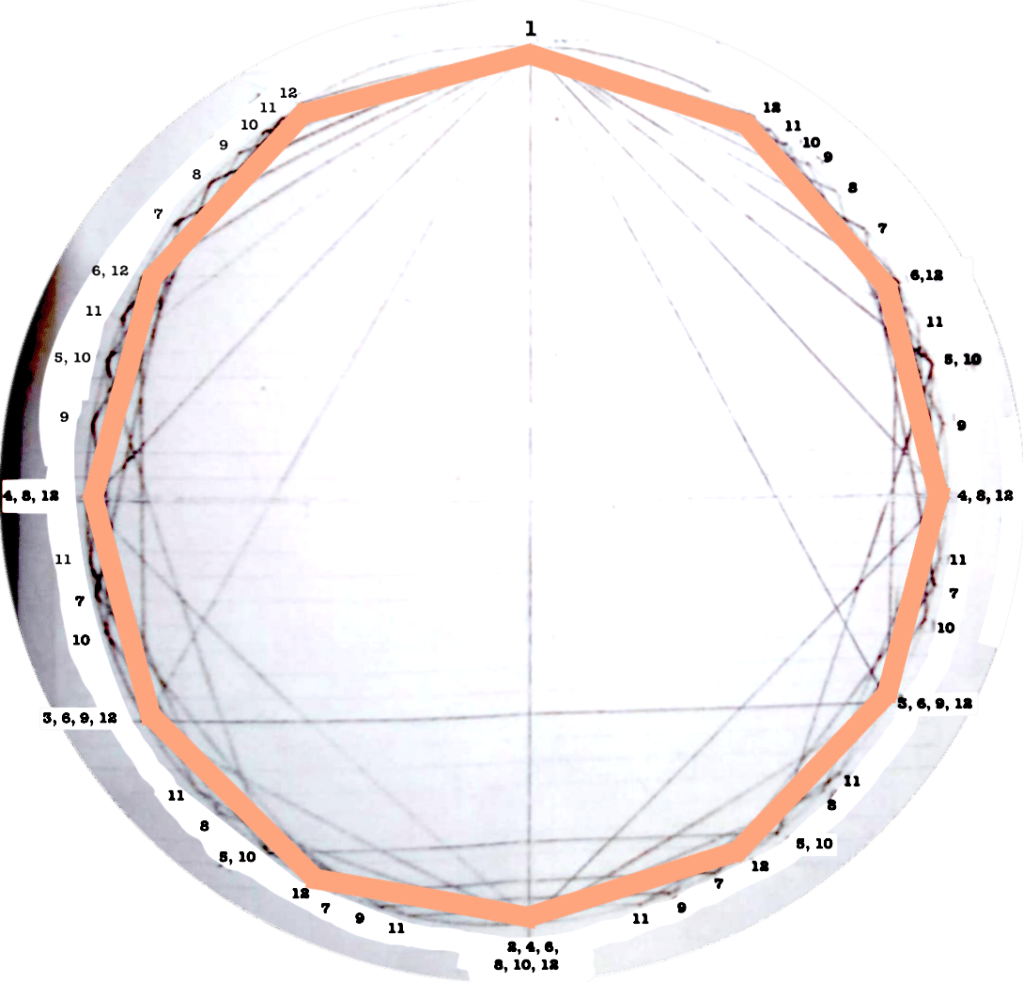
Even though it might seem obvious, I find interesting to note that the more faces the polygon has (equals: the more subdivisions you do of a “one”) the closest you get to the circumference (equals: a continuous sound).
Also, it is interesting to note that from two points of the circumference there’s only one possible line passing. Which means, the most little events that have to happen to define/percieve a constant pulsation, is two pointillistic gestures.
The first version of circles dealt with rhythms/polygons from 1 to 12.
In October 2024 I could realize a second version including polygons/rhythms from 1 to 16. Interestingly, this representation broughrt me a new question: what’s in the center of the circle?
Related resources
If you are interested in graphic/geometrical representations, here are few of the many related resources I found out during the years. I wasn’t aware of them in the time I made my first diagram, and it was a great joy to find other perspectives on a same attitude.
Miles Okazaki – 351 shapes
Malcolm Braff – General Theory of Rhythm
Polymetronome – open source app for Android
John Coltrane’s diagram on pitch, scales, intervals
French visionary percussionist Toma Gouband’s graphs
Fernando Benadon – A circular plot for rhythm visualization and analysis
